Final Consumption of Energy in Households
- In 2024, household final energy consumption was 65 TWh, i.e. about 23% of total final consumption. Household electricity consumption was 22 TWh.
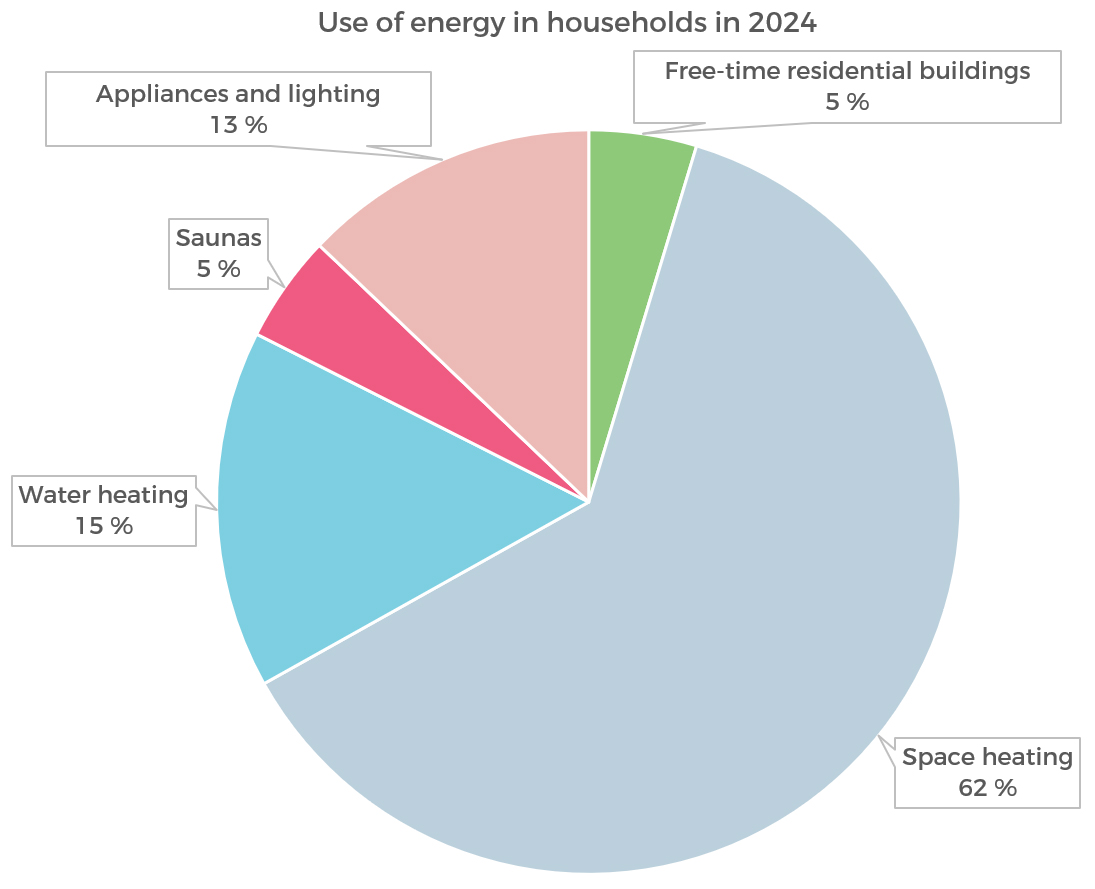
- Of household energy use, space heating accounted for 62%, water heating 16%, saunas 5%, lighting and appliances 13%, and holiday homes 5%.
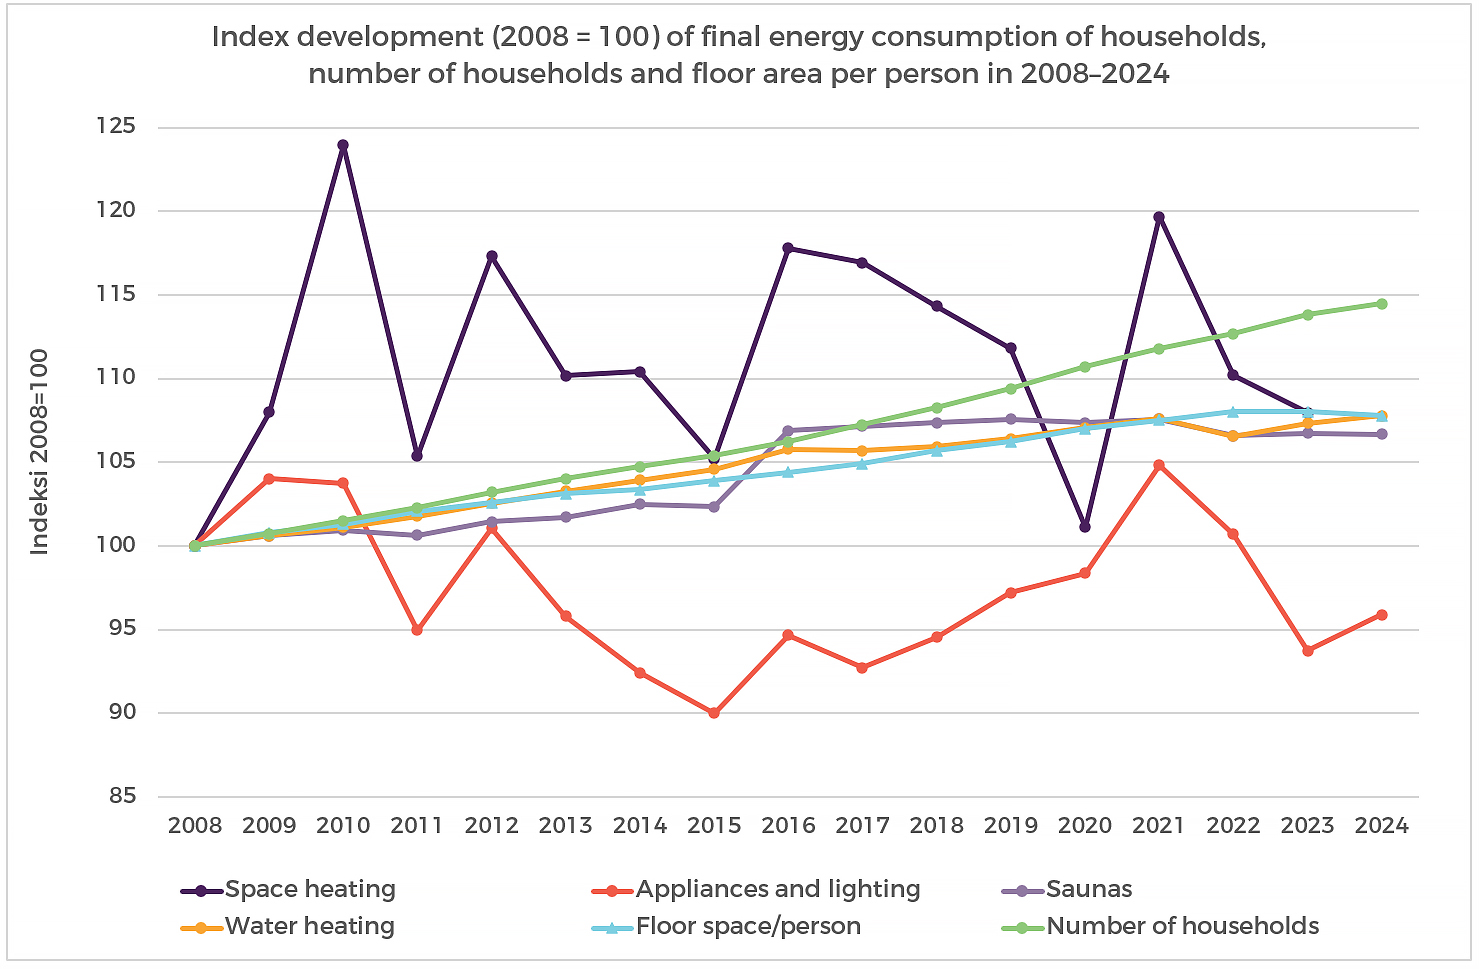
- Household final energy consumption increased by 19% over 2000–2024 (without temperature correction). At the same time, the number of households increased by 14% and total floor area by 37%.
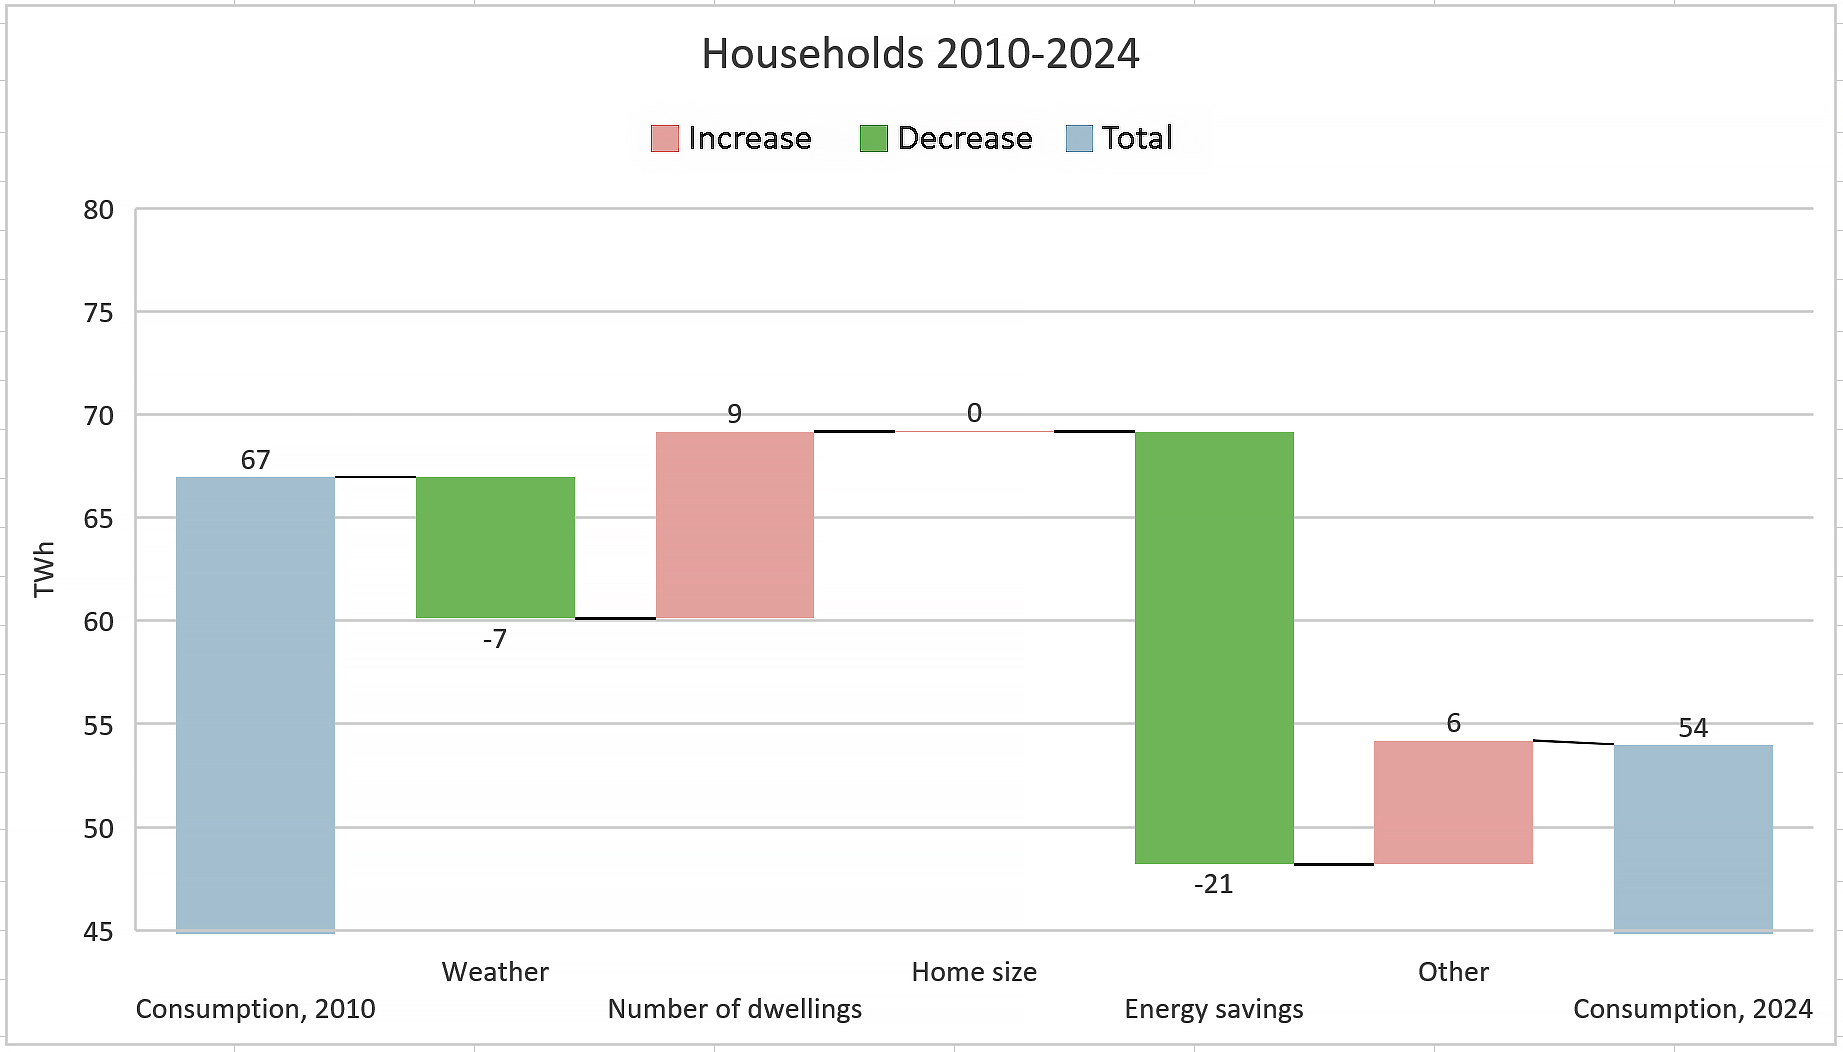
The next figure shows the final energy consumption of households in 2010 and 2024, and an analysis of factors which have affected the observed change in consumption (so-called decomposition analysis).
- Household final energy consumption decreased by 13 TWh over the period.
- Weather reduced consumption by 6.9 TWh.
- Changes in the number of dwellings would have increased consumption by 9.1 TWh without other factors.
- The size of dwellings did not increase over the period.
- Energy efficiency measures reduced consumption by 21 TWh.
- Other factors, such as changes in consumption behaviour, increased consumption by 6 TWh.

Lea Gynther
Senior Expert