Final Consumption of Energy in Industry
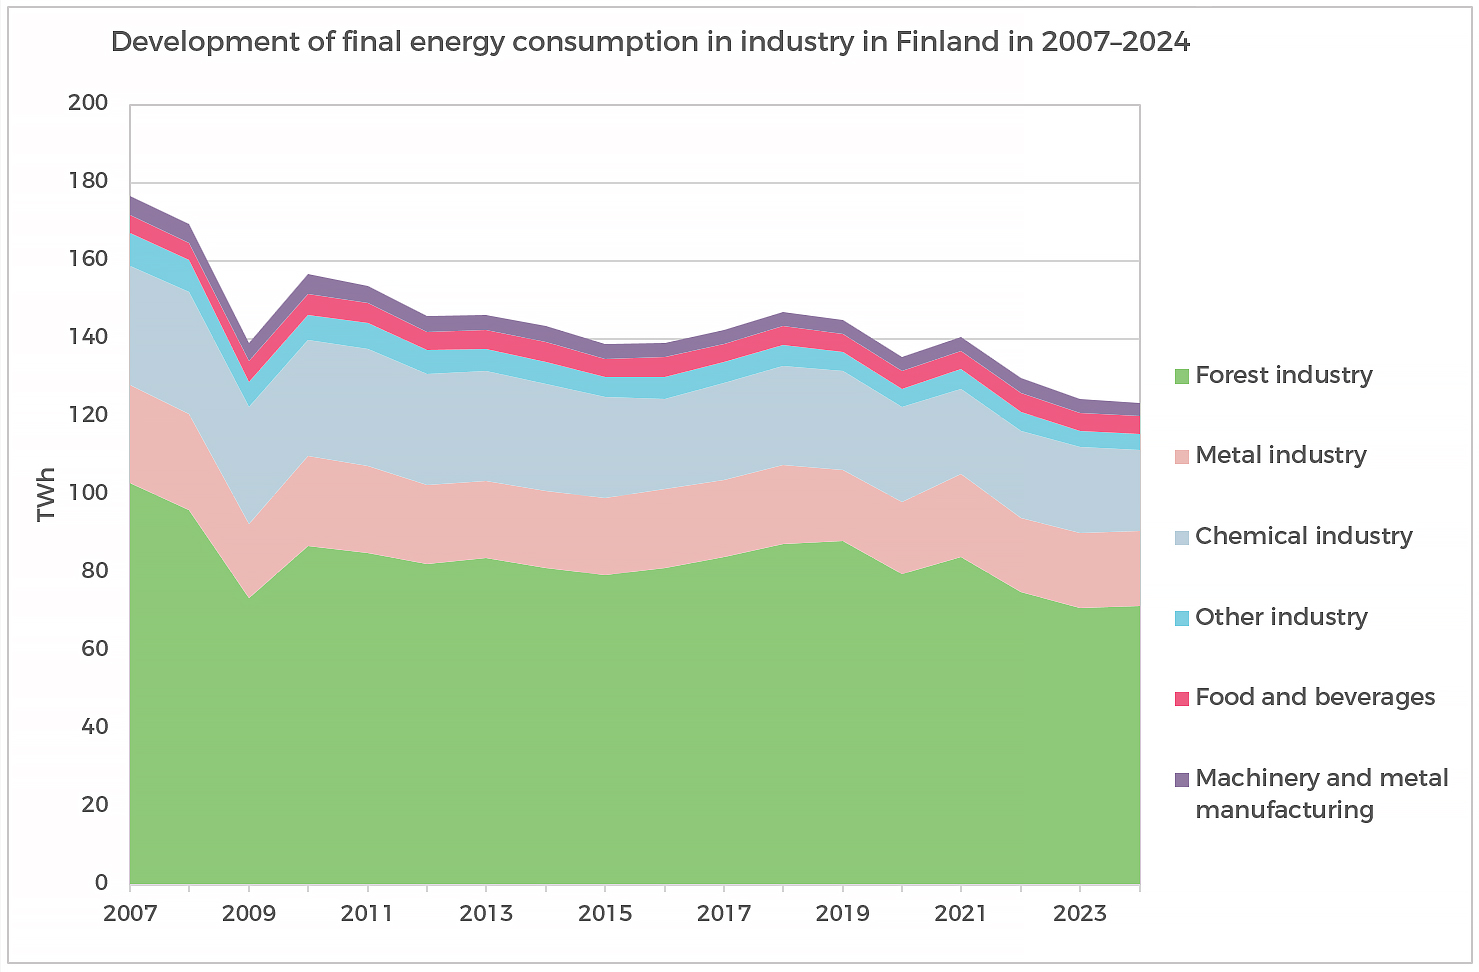
- In 2024, industrial final energy consumption (excluding mining) in Finland was 121 TWh, i.e., about 43% of total final consumption. Electricity consumption in industry was 34 TWh.
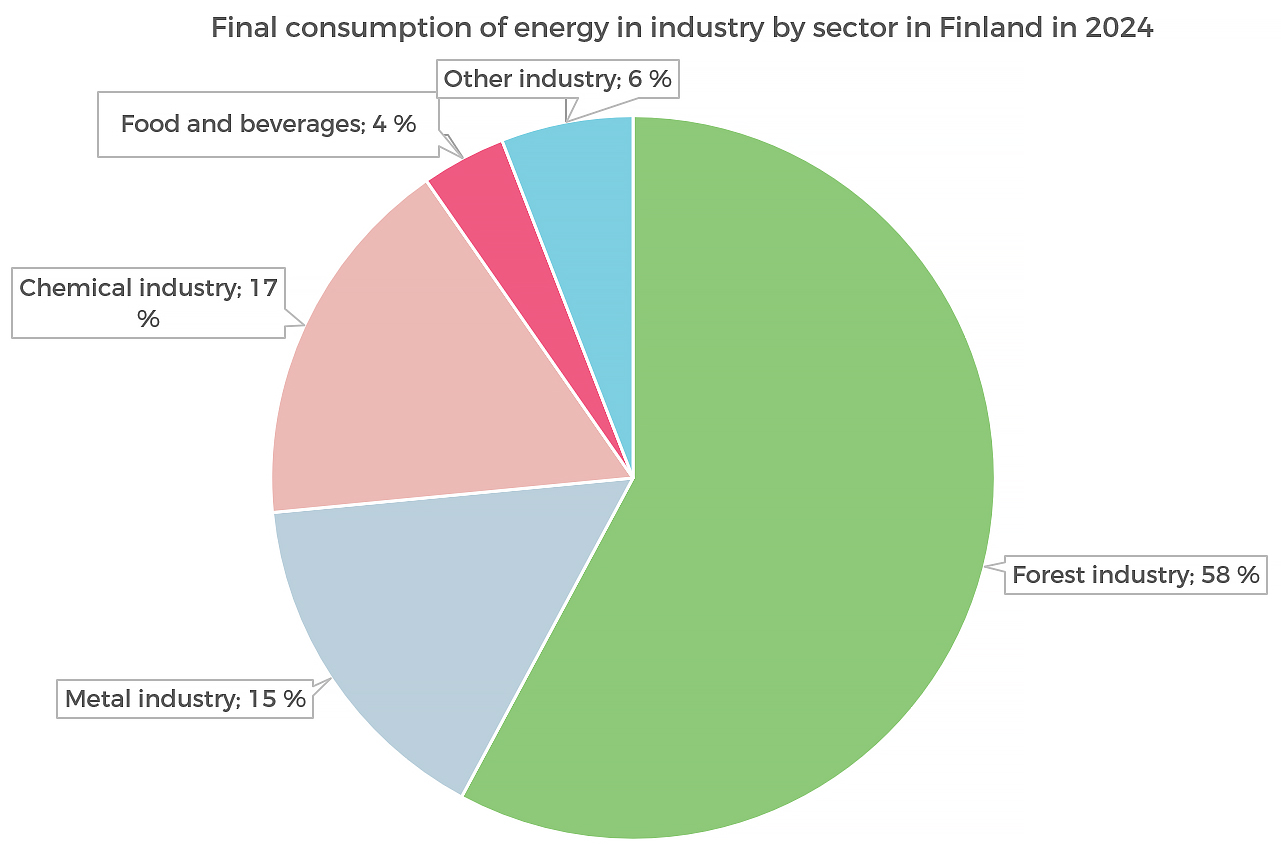
- The forest industry accounted for about 58% of industrial final energy consumption, the chemical industry 17%, and metal processing 15%.
- Industrial final energy use decreased by 21% over the period 2000–2024. The volume index describing industrial production increased by 17% over the same period, but development varied significantly across energy-intensive sectors. In the forest industry, the volume index decreased by 25% over 2000–2024, while in the chemical industry it increased by 30% and in the metal industry by 33%.
Note! Click on the image to enlarge it.
Note! Click on the image to enlarge it.
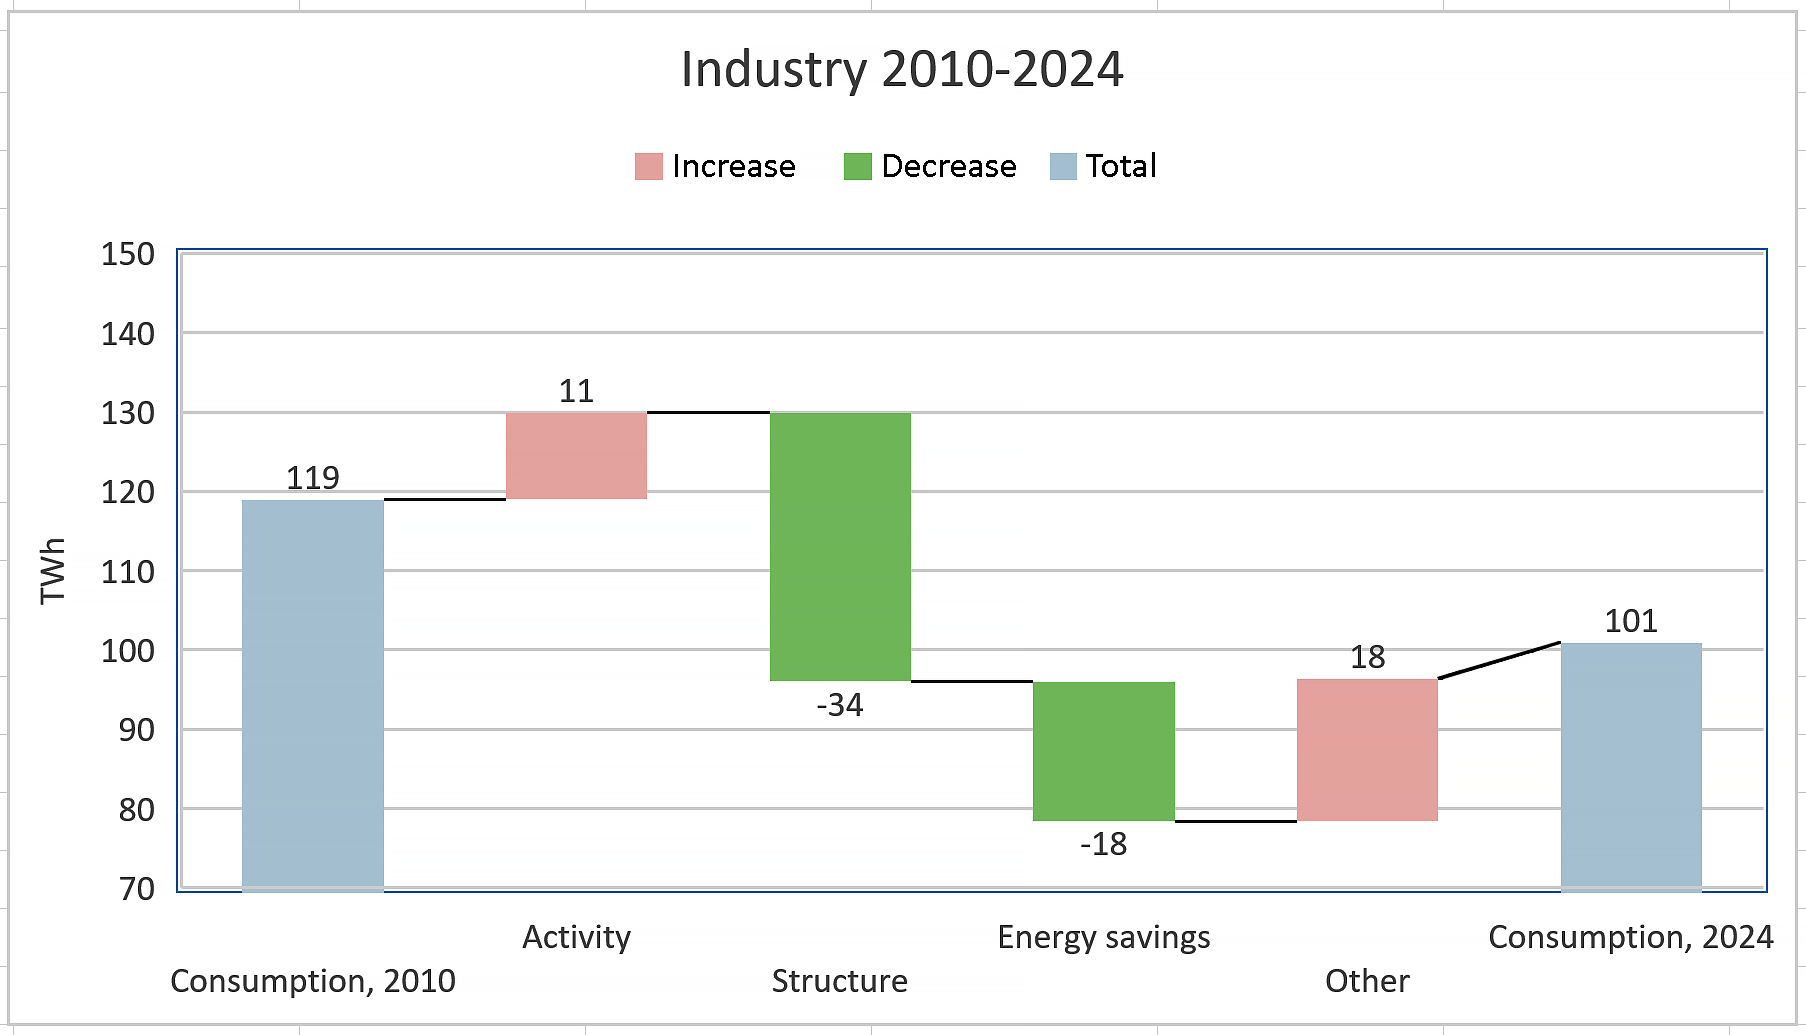
The following figure presents industrial energy consumption in 2010 and 2024 and analyses the factors affecting changes in consumption (so-called decomposition analysis).
- Industrial energy consumption decreased by 18 TWh over the period.
- Activity level, measured by the volume index would have increased energy consumption by 11 TWh, all other things equal.
- Structural change, reflecting differing development across sectors, reduced consumption by 34 TWh.
- Energy efficiency measures reduced consumption by 18 TWh.
- “Other” factors increased consumption by 18 TWh, including, for example, inflexible consumption due to reduced utilisation rates.
Source: Odyssee Database
Note! Click on the image to enlarge it.

Lea Gynther
Senior Expert