Final Consumption of Energy in Services
- The services sector includes both public services and the private service sector. Commercial buildings represent the largest floor area (32 million m² in 2024). There are also significant amounts of warehouses (26 million m²) and offices (20 million m²), used by both private and public sectors. In the public sector, the largest building stock is in education (23 million m²), roughly double that of healthcare.
- In 2024, final energy consumption in the services sector was approximately 40 TWh, i.e. about 14% of total final consumption.
- Energy consumption for heating service buildings was about 19 TWh and electricity consumption 20 TWh in 2024.
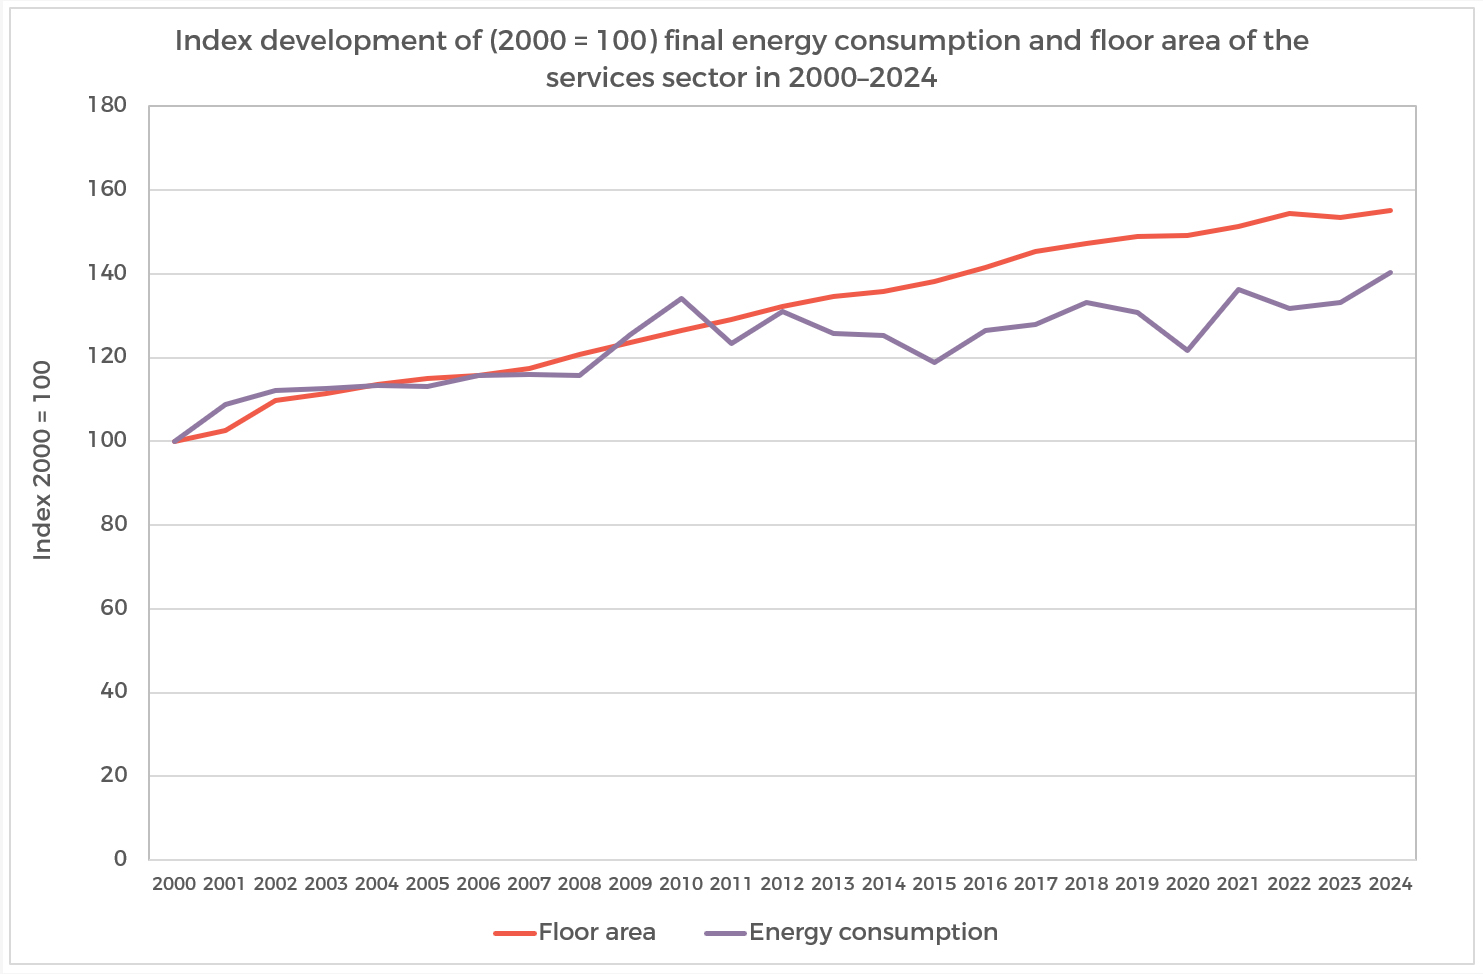
- Final energy consumption in services increased by 40% over 2000–2024 (without temperature correction). During the same period, total floor area increased by 55%; growth occurred in all sectors, particularly in commercial buildings (+60%) and warehouse buildings (+67% over 2005–2024).
Note! Click on the image to enlarge it.
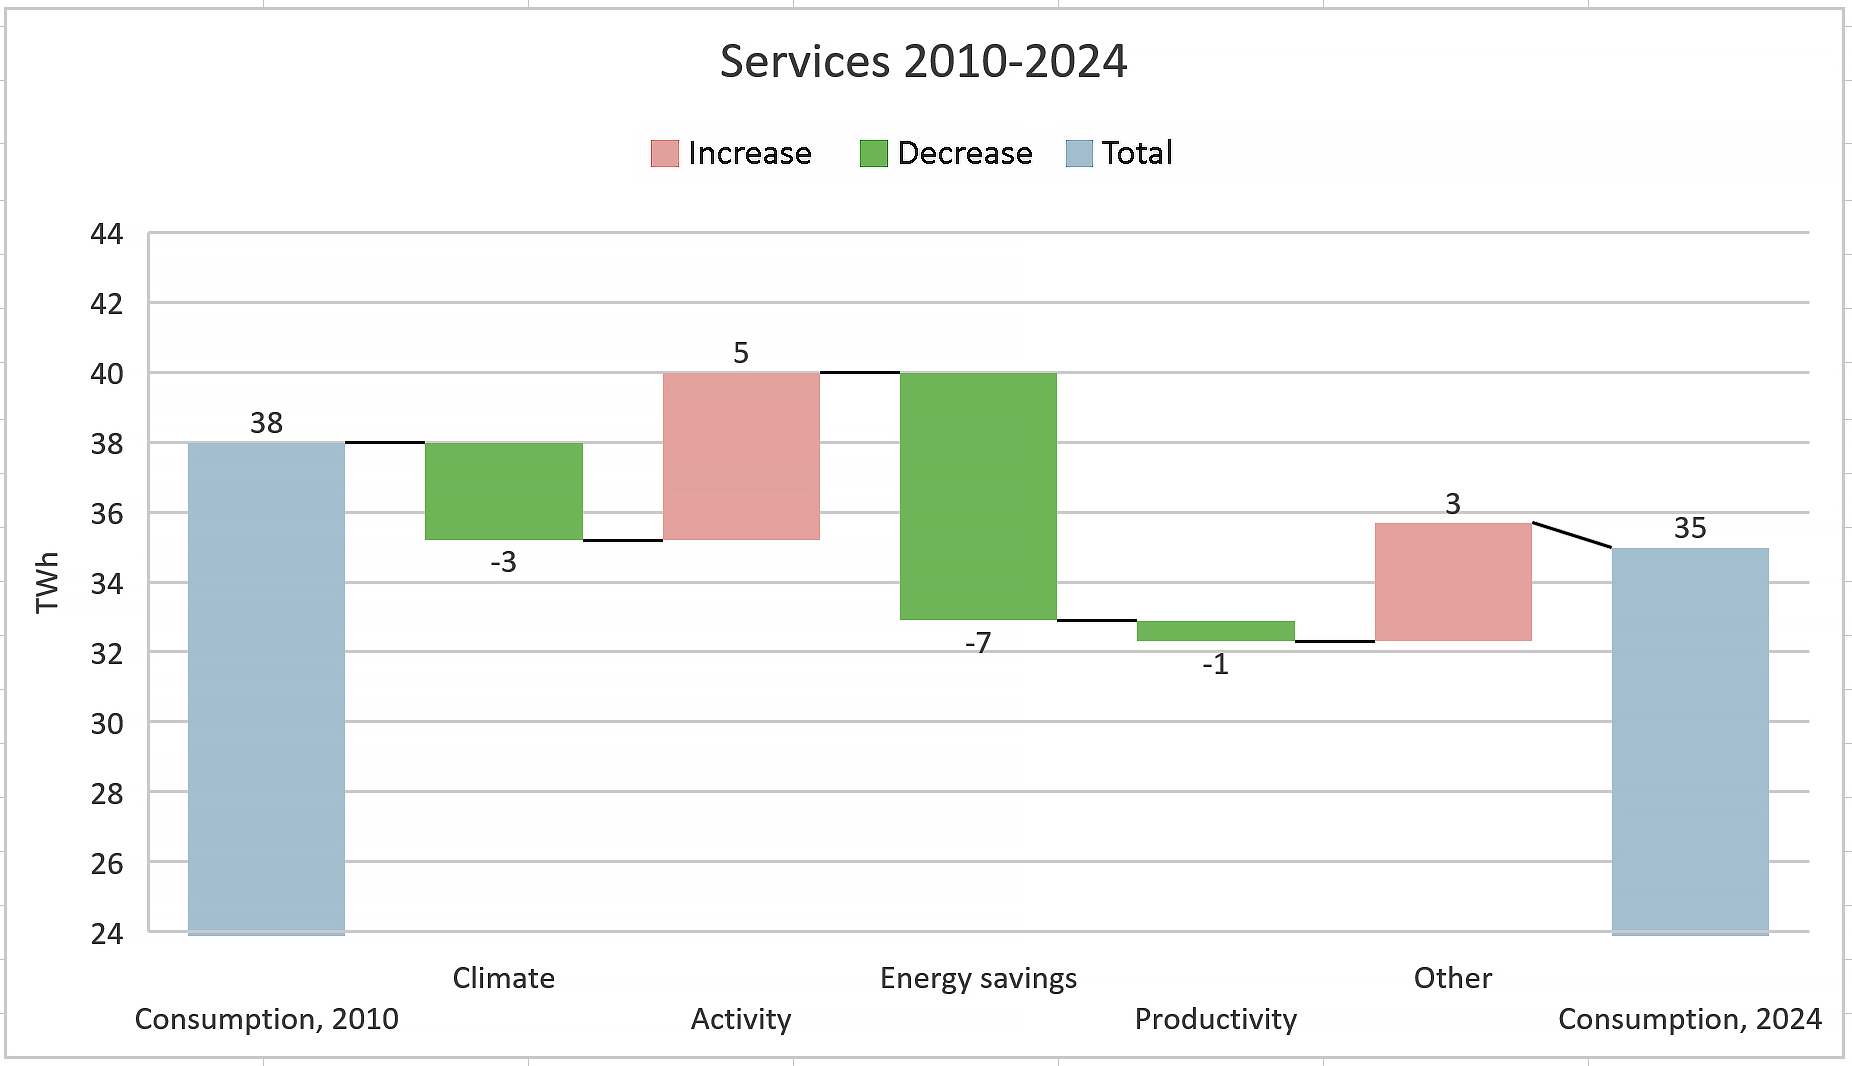
The next figure shows the final energy consumption of the services sector in 2010 and 2024, and an analysis of factors which have affected the observed change in consumption (so-called decomposition analysis).
- Final energy consumption in services decreased by 3 TWh over the period.
- Weather reduced consumption by 2.8 TWh.
- Activity level of the services sector is measured by changes in value added. Growth in value added would have increased consumption by 4.8 TWh, all other things equal.
- Energy efficiency measures reduced consumption by 7.1 TWh. However, this indicator is weak, as it is based on energy consumption per employee and does not measure energy efficiency.
- Productivity change, measured as value added per employee, reduced consumption by 0.6 TWh.
- Other factors, including behavioural changes, increased consumption by 3.4 TWh.
Source: Odyssee Database
Note! Click on the image to enlarge it.

Lea Gynther
Senior Expert